TrendLine Saskatchewan


TrendLine Saskatchewan - December 2018

The Saskatchewan economy continues to show varying results in the first 10 to 11 months of 2018.

Stephen Johnson

MA
Chief Economist

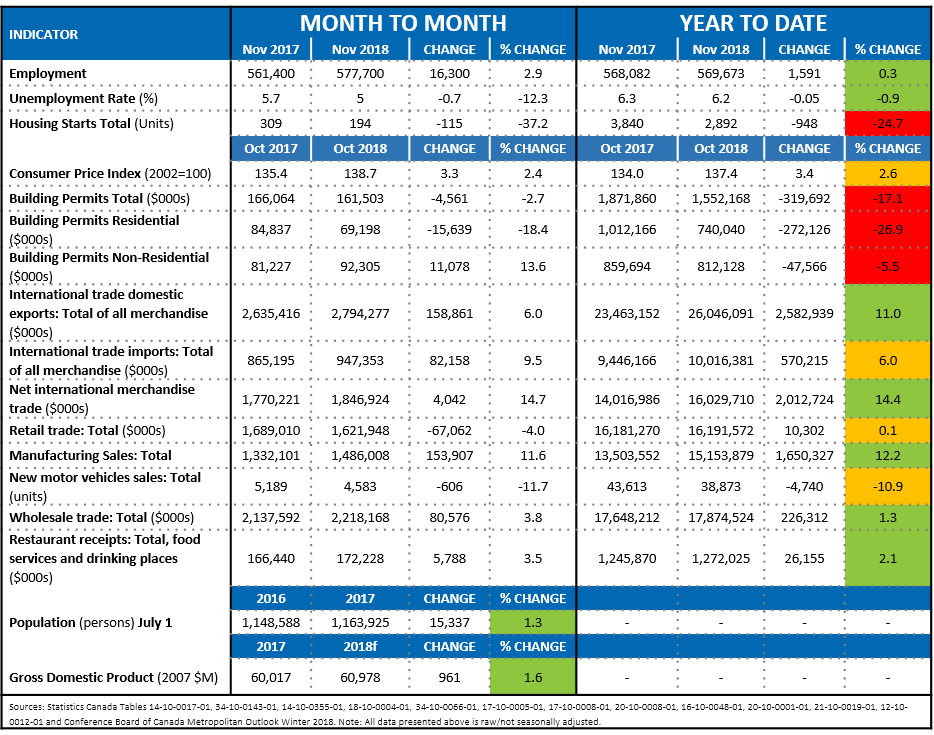
Average year-to-date employment has slightly increased, with the unemployment rate decreasing. Housing starts, building permits, and new motor vehicle sales have all decreased while manufacturing sales, exports, wholesale trade, restaurant receipts, and retail trade increasing. Percentage increases in retail trade at 0.1% lag well behind the rate of inflation.

Total average year-to-date employment in Saskatchewan was up 0.3% or 1,591 positions in January to November 2018, compared to the same period in 2017. Saskatchewan has benefitted from a year-over-year increase of 16,300 positions.

Composite Indicator Actual & Seasonally Adjusted

Key Indicator This Month

Employment

569,673

Up 0.3% Year to Date

Employment

569,673

Up 0.3% Year to Date

Dashboard

TrendLine December 2018

In Detail

  • When compared to November 2017, year-to-date employment in November 2018 increased in the following sectors: utilities (182), manufacturing (36), finance, insurance, real estate and leasing (1,218), business, building and other support services (1,464), educational services (1,909), health care and social assistance (2,109), accommodation and food services (891), other services (1,627), and public administration (1,446).
  • ­Compared to November 2017, year-to-date employment in November 2018 declined in agriculture (-209), resource extraction (-173), wholesale and retail trade (-2791), transportation and warehousing (-200), professional, scientific and technical services (-4191), and information, culture and recreation (-391).
  • Construction employment continues to decline. When compared to November 2017, year-to-date construction employment in November 2018 decreased by 1,255 positions.
  • The average year-to-date unemployment rate dropped from 6.3% in November 2017 to 6.2% in November 2018.
  • The average year-to-date number of unemployed people has decreased from 38,355 in November 2017 to 37,773 in November 2018.
  • Compared to November 2017, total year-to-date housing starts in November 2018 have declined by 948 units or 24.7% in singles (-681 units or -37.3%), semi-detached (-138 units or -47.3%), and row housing (-188 or -36.7%). Total year-to-date housing starts in November 2018 increased in apartment and other types (59 units or 4.9%). 
  • Year-to-date building permits in October 2018 declined 17.1% over the same period in 2017. Industrial building permits was the only sub-sector to post an increase of 31.2%. Residential (-26.9%), commercial (-7.7%), and institutional and governmental (-30.7%) sub-sectors posted declines.
  • Year-to-date retail trade is up by 0.1% in October 2018 when compared to the same period in 2017. Sub-sectors that posted increases were: gasoline stations (6.9%), electronics and appliance stores (6.7%), health and personal care stores (1.4%), clothing and clothing accessories stores (0.8%), grocery stores (1.7%), beer, wine and liquor stores (11.6%), general merchandise stores (1.1%), and all other (4.0%). The following sub-sectors posted declines: new car dealers (-6.8%), used car dealers (-20.5%), furniture and home furnishings stores (-7.9%), building material and garden equipment and supplies dealers (-0.6%), and sporting goods, hobby, book and music stores (-4.1%).
  • ­ Year-to-date manufacturing sales have increased by 12.2% in October 2018 when compared to the same period in 2017. Sub-sectors that posted increases were: food manufacturing sales (9.5%), machinery manufacturing sales (6.0%), fabricated metal product manufacturing sales (11.0%), and all other Manufacturing sales (22.5%). Chemical manufacturing sales was the only sub-sector that posted a decline of 6.0%.­
  • Year-to-date new motor vehicle sales declined 10.9% in October 2018 when compared to October 2017. New passenger cars sales declined 19.2% and new minivans, sport-utility vehicles, light and heavy trucks, vans and buses sales declined 9.3%.
  • ­ Total international merchandise exports increased 11.0% year-to-date from October 2017 to October 2018. Sub-sectors that posted increases were: energy products (29.8%), metal ores and non-metallic minerals (20.9%), metal and non-metallic mineral products (46.5%), forestry products and building and packaging materials (24.8%), industrial machinery, equipment and parts (21.8%), and motor vehicles and parts (5.1%). Sub-sectors that posted decreases were: farm, fishing and intermediate food products (-3.6%), basic and industrial chemical, plastic and rubber products (-13.8%), electronic and electrical equipment and parts (-4.5%), aircraft and other transportation equipment and parts (-66.5%), consumer goods (-26.9%), and special transactions (-0.7%).
  • ­ Year-to-date wholesale trade increased 2.0% from October 2017 to October 2018. Sub-sectors that posted increases were: food, beverage and tobacco merchant wholesalers (11.6%), machinery, equipment and supplies merchant wholesalers (1.5%), building material and supplies merchant wholesalers (8.0%), and all other (4.4%). Farm product merchant wholesalers, and agricultural supplies merchant wholesalers declined 3.1% and 0.3%, respectively.
  • Year-to-date restaurant receipts increased 1.7% from October 2017 to October 2018. Within restaurant receipts, full-service restaurants (3.1%) and limited-service eating places (2.5%) posted increases. Declines were noted in special food services (-11.4%), and drinking (alcoholic beverages) places (-2.6%).

This Issue's Economist:

Stephen Johnson

MA
Chief Economist

This Issue's Editor:


TrendLine Saskatchewan is published monthly by Praxis Consulting.