2019 in Review - April 2020
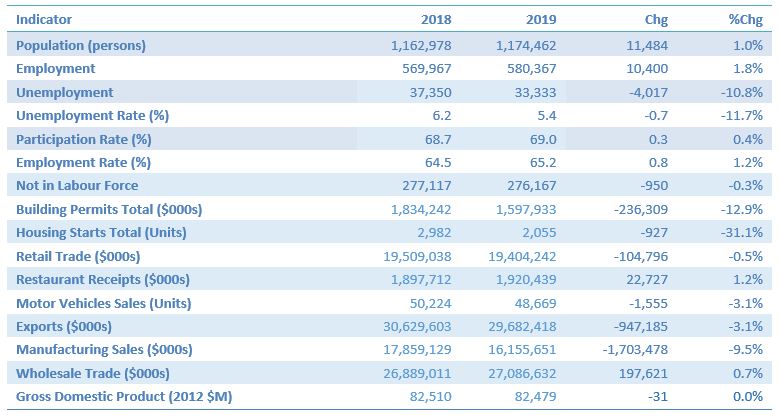
Despite a surging labour market and the province's population reaching an all-time high, the consumer remained in near hibernation throughout 2019, with both year-to-date retail sales and new motor vehicle sales dropping.
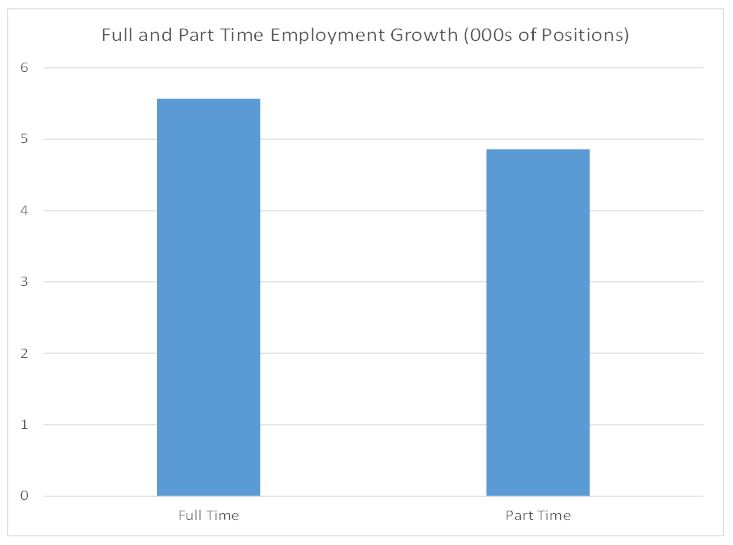
A closer examination of employment growth over the year (an increase of 5,600 full time jobs and 4,900 part time jobs) explains, in part, some of the consumer’s sluggish behaviour.
Construction activity was virtually dormant with both building permits and housing starts in steep decline. Meanwhile, wholesale trade and restaurant receipts were up, international exports and the international surplus in goods were down along with resource production and manufacturing sales.
The Conference Board of Canada, in its revised (including pandemic impacts) Spring 2020 Outlook predicts a 5% decline in real GDP in 2020. Employment in the province is expected to fall by 2.8% with the largest job losses hitting the arts, entertainment and recreation, accommodations, and food sectors. The Conference Board expects both GDP and employment to rebound in 2021, by 5.4% and 2.9% respectively.
2019 in Review - April 2020
Despite a surging labour market and the province's population reaching an all-time high, the consumer remained in near hibernation throughout 2019, with both year-to-date retail sales and new motor vehicle sales dropping.
A closer examination of employment growth over the year (an increase of 5,600 full time jobs and 4,900 part time jobs) explains, in part, some of the consumer’s sluggish behaviour.
Construction activity was virtually dormant with both building permits and housing starts in steep decline. Meanwhile, wholesale trade and restaurant receipts were up, international exports and the international surplus in goods were down along with resource production and manufacturing sales.
The Conference Board of Canada, in its revised (including pandemic impacts) Spring 2020 Outlook predicts a 5% decline in real GDP in 2020. Employment in the province is expected to fall by 2.8% with the largest job losses hitting the arts, entertainment and recreation, accommodations, and food sectors. The Conference Board expects both GDP and employment to rebound in 2021, by 5.4% and 2.9% respectively.
Population and Demographics
The provincial population on July 1, 2019 was up 1.0% over July 1, 2018 to 1,174,462 on the strength of a 14,000 person surge in international in-migration.
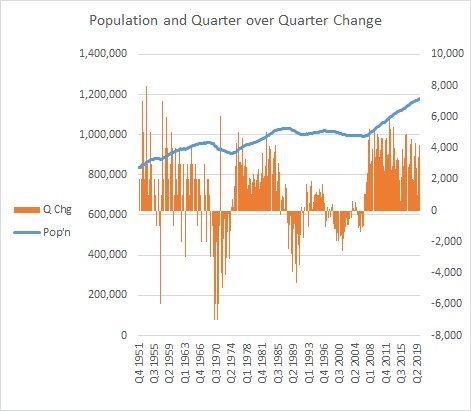
Since 1951, Saskatchewan has experienced 3 major surges in population followed by a plateau and modest declines. The first, from 1951 to 1968, saw the quarterly population advance from 834,000 in 1951 to 962,000 in 1968. This was followed by a drop to 907,000 in 1974. The next population surge was from 1974 to 1987 where it peaked at 1,032,000 in 1987. From 1987 to 1991, the population oscillated between a high of 1,032,000 and a low of 991,000 in 2006. The next surge took place from 2006 to 2019 (so far) fueled largely by international in-migration.
Sources of Population Growth
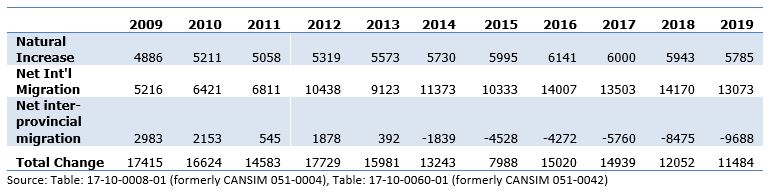
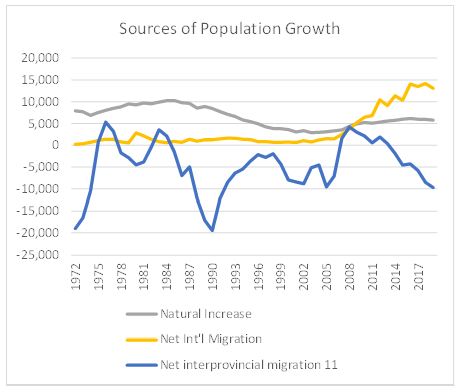
Driving population growth since 2005 has been international in-migration (immigration) and, to lesser extents, the natural increase (births less deaths). Migration from other provinces (net inter-provincial migration) has been negative since 2014.
Of concern is the continued drop in net inter-provincial migration (392 in 2013 to -9,688 in 2019). At this level, net inter-provincial migration negates any population gains due to natural increase which is now under 50% of international in-migration.
Labour Market
The Province’s current labour force statistics need to be viewed within the context of historical labour force statistics and inter-provincial comparisons to examine the significance of current trends.
Definitions
Employment: Employed persons are those who, during the reference week, did any work for pay or profit, or had a job and were absent from work.
Unemployment: Unemployed persons are those who, during reference week, were available for work and were either on temporary layoff, had looked for work in the past four weeks or had a job to start within the next four weeks
Labour force: Civilian non-institutional population 15 years of age and over who, during the survey reference week, were employed or unemployed.
Unemployment rate: Number of unemployed persons expressed as a percentage of the labour force. The unemployment rate for a particular group (for example, age, sex, marital status) is the number of unemployed in that group expressed as a percentage of the labour force for that group.
Participation rate: Total labour force expressed as a percentage of the population aged 15 years and over. The participation rate for a particular group (for example, women aged 25 years and over) is the labour force in that group expressed as a percentage of the population for that group.
Employment rate (employment/population ratio): Number of employed persons expressed as a percentage of the population 15 years of age and over. The employment rate for a particular group (age, sex, marital status, province, etc.) is the number employed in that group expressed as a percentage of the population for that group.
Seasonal adjustment: Fluctuations in economic time series are caused by seasonal, cyclical and irregular movements. A seasonally adjusted series is one from which seasonal movements have been eliminated. Seasonal movements are defined as those which are caused by regular annual events such as climate, holidays, vacation periods and cycles related to crops, production and retail sales associated with Christmas. Removing seasonal fluctuations from the data, allows for month to month comparisons.
Source: Statistics Canada, Guide to the Labour Force Survey. Catalogue no. 71-543-G
In order to examine long term trends, it is necessary to focus on seasonally adjusted data.
The graph below of total provincial employment allows for two important observations. First, one can see how the seasonally adjusted series is smoother than the actual/raw series and runs roughly at the midpoint of the raw series. Second, it is clear that the province experienced twoclear sustained periods of employment growth. The first ran from 1976 to 1986. This was followed by a plateau where employment ranged from 482,000 (July 1986) to 487,000 (July 2000) and 453,000 (November 2001). This was followed by the second period of sustained expansion to 589,000 in June 2015.
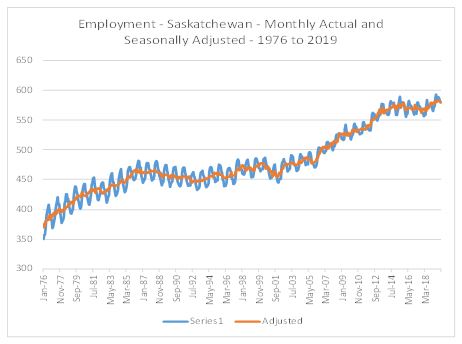
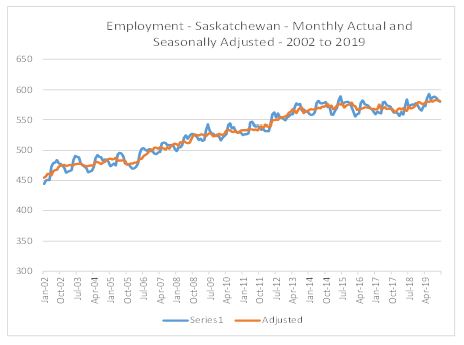
Between June 2015 and June 2019 (where employment reached an all-time high of 592,900), employment growth was relatively anemic. It is clear that 2020 employment will not approach 2019 levels with the COVID-19 pandemic and it was unlikely that, even without the pandemic, the province would have returned to record setting employment.
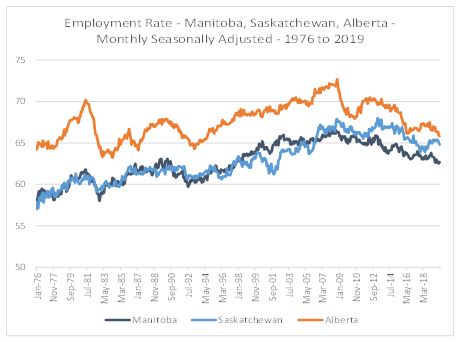
 Using the employment rate (number of employed persons expressed as a percentage of the population 15 years of age and over), it is possible to make valid inter-provincial comparisons. Saskatchewan compares favourably to Manitoba, with Saskatchewan falling behind from 1998 to 2006, but pulling ahead from 2007 to 2019. Saskatchewan has not performed well relative to Alberta. However, the gap has narrowed since the oil price crash of 2014.
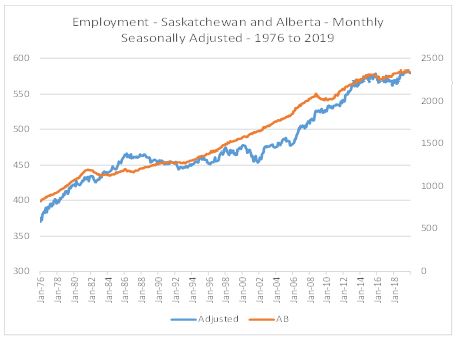
 In terms of overall employment growth, Saskatchewan led Albert from 1983 to 1990, but fell considerably behind until 2013. Similar to the employment rate, the employment growth gap narrowed substantially following the oil price crash of 2014.
While seasonal adjusted data allow month to month comparisons, it should be noted that these figures do not represent the actual number of individuals employed or unemployed. The more valid comparison is using the year-over-year change, comparing the raw data against the same month in a prior year.
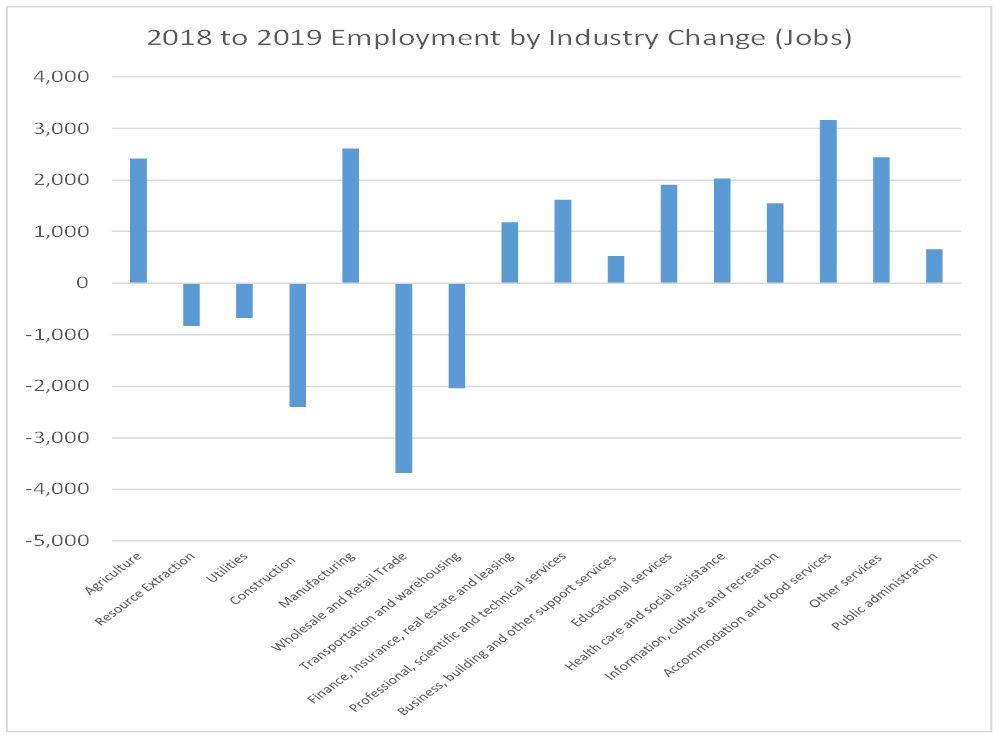
Total employment in Saskatchewan was up 1.8% or 10,400 positions in 2019 over 2018. Year-to-date employment in December 2019 was up over the same period in 2018 in Agriculture (2,408), Manufacturing (2,608), Finance, insurance, real estate and leasing (1,175), Professional, scientific and technical services (1,617), Business, building and other support services (525), Educational services (1,908), Health care and social assistance (2,033), Information, culture and recreation (1,550), Accommodation and food services (3,167), Other services (2,433), and Public administration (658). Year-to-date employment in December 2019 was down in Resource Extraction (-842), Utilities (-683), Construction (-2400), Wholesale and Retail Trade (-3683), and Transportation and warehousing (-2033).
While a 10,400 employment increase to a record level of employment is impressive, it was not matched by an equivalent surge in consumer activity, manufacturing, exports, and construction, which was particularly weak. Further analysis indicates that almost half (46%) of employment growth in 2019 was in part-time positions.
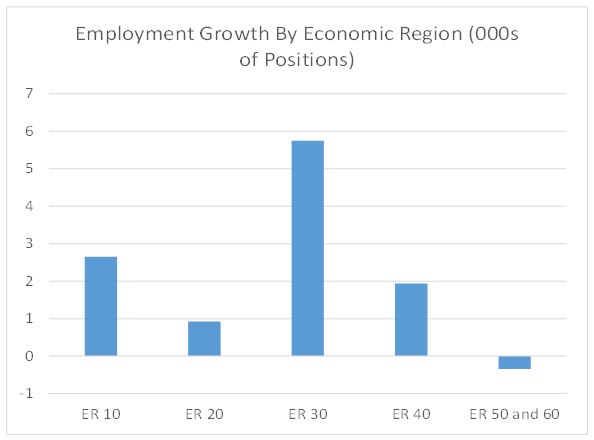
 Within Economic Regions (ERs), employment growth was not evenly distributed and concentrated in ERs with large urban centres. ER 30 (Saskatoon-Biggar) saw the largest increase, followed by ER 10 (Regina-Moose Mountain). ER 50 and 60 (Prince Albert and North) saw a modest decline.
Construction
Construction activity in Saskatchewan in 2019 was mostly negative. New housing starts are a good indicator of a region’s economic health. New housing has powerful multiplier effect through the economy and is typically used to derive estimates for other consumer-based indicators. People buying new homes also spend money on other consumer goods such as furniture, lawn and garden supplies, and home appliances.
Labouring under over supply and tighter mortgage rules, 2019 total housing starts were down by -927 units or -31.1%. Annual declines were widespread across all sub-categories: singles (-275 units or -22.3%), semi-detached (-36 units or -21.8%), row (-64 units or -19.4%), and apartment and other types (-552 units or -44.0%).
 Despite a weak showing in 2019, it should be noted that this is only the 10th worst performance since 1948. Performance in 1991 to 1995 was significantly worse.
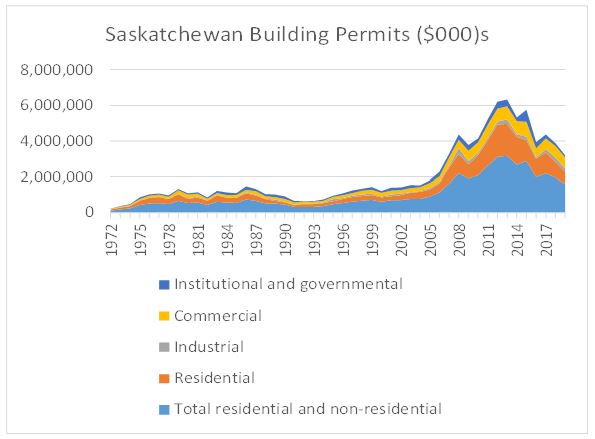 A city building permit is needed to construct, demolish, build an addition, or renovate a building. The city issues the permit and reviews plans to ensure they comply with all current building codes, bylaws and other applicable regulations. Building permits, also a leading indicator of construction activity, were down -12.9% over 2018. Sub sectors that posted increases were limited to: commercial (2.3%). During the same time period, residential (-19.5%), industrial (-19.5%), and institutional and governmental (-26.8%) posted declines. It should be noted that building permit values are not adjusted by inflation. As such, a portion of the increase from the early 1990s to 2019 (graph above) was driven by construction price increases.
The Consumer
Consumer spending accounts for 45 to 50% of GDP and is key to sustained economic growth. Unfortunately, the consumer was reluctant to open his/her wallet in 2019, driven in part by soft full time employment and wage growth.
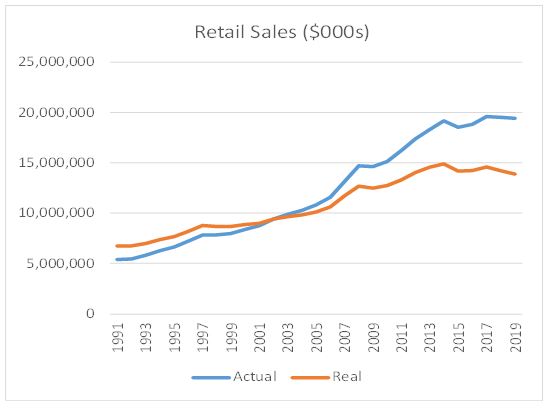
2019 retail trade was down by -0.5% over 2018. Sub sectors that posted increases were: Used car dealers (20.4%), Gasoline stations (2.9%), Health and personal care stores (2.8%), Grocery stores (2.2%), General merchandise stores (0.1%), and All other (1.7%). During the same time period New car dealers (-3.3%), Furniture and home furnishings stores (-0.6%), Electronics and appliance stores (-25.0%), Building material and garden equipment and supplies dealers (-4.4%), Clothing and clothing accessories stores (-4.9%), Sporting goods, hobby, book and music stores (-2.8%), and Beer, wine and liquor stores (-2.0%) posted declines.
When adjusting retail sales for inflation (deflating retail sales by all-items CPI), the drop is more severe. 2019 real retail trade dropped by 2.2% from 2018 and has exhibited very little growth since 2014.
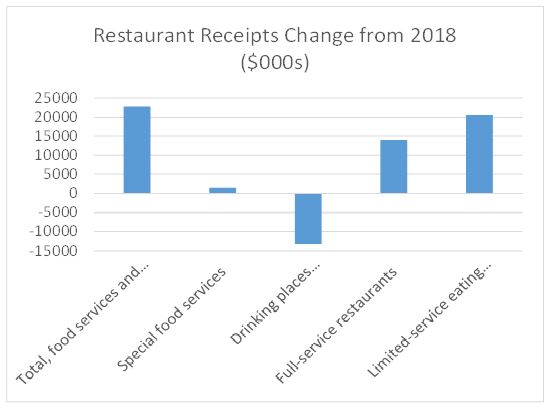
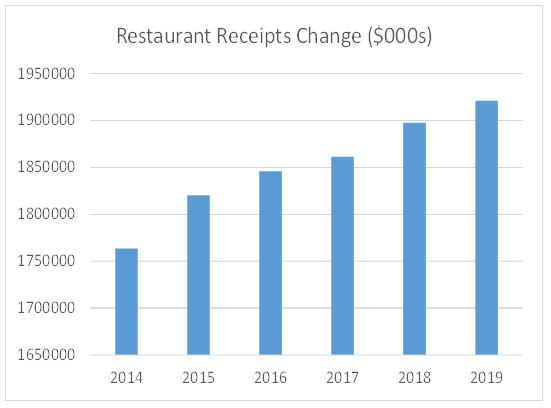
Restaurant receipts data tends to reflect how consumers are feeling about the future of the economy, their job situation, and the overall steadiness of the restaurant industry. 2019 restaurant receipts were up 1.2% over 2018, less than the rate of inflation. Within restaurant receipts Special food services (1.7%), Full-service restaurants (1.8%), and Limited-service eating places (2.1%) increased. At the same time, declines were noted in Drinking places (alcoholic beverages) (-13.3%).
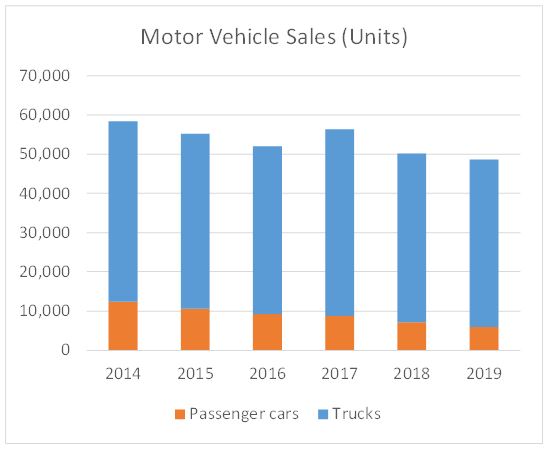
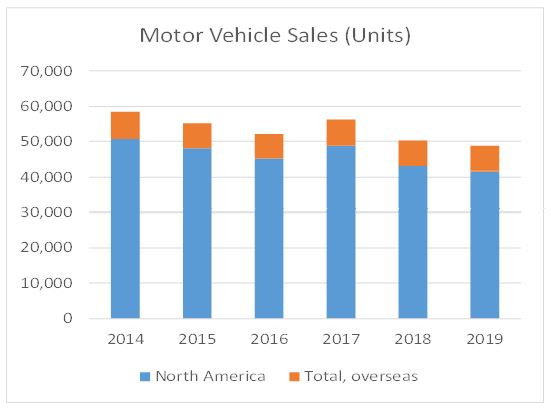
Consumer confidence is also reflected in consumer motivation to buy a new vehicle. It is often as critical a component of auto sales as consumer ability to pay and access to credit. 2019 new motor vehicle sales were down -3.1% from 2018. New minivans, sport-utility vehicles, light and heavy trucks, vans and buses sales were down -0.8%. New passenger cars sales were also down -17.2%.
It is clear from the charts below that, even in a downturn, Saskatchewan consumers show a preference towards the “trucks” category, which included new minivans, sport-utility vehicles, light and heavy trucks, vans and buses, over passenger cars and those manufactured in North America over those manufactured overseas.
Other Indicators
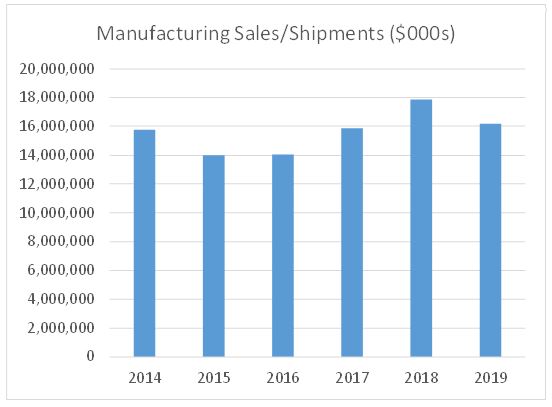
A healthy manufacturing sector is considered a key element of a healthy economy. Manufacturing adds value to raw products, is a source of high paying jobs, innovation, and typically maintains higher multipliers than the rest of the economy. In 2017 (the latest data available), manufacturing accounted for 6.5% of the provincial economy.
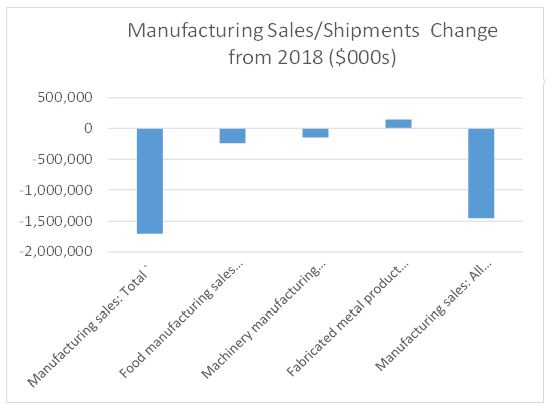
In Saskatchewan 2019, manufacturing sales were down by -9.5% over 2018. Sub sectors that posted increases were limited to fabricated metal product manufacturing sales (18.4%). Sub sectors that posted decreases were Food manufacturing sales (-5.0%), Machinery manufacturing sales (-11.5%), and All other Manufacturing sales (-13.4%).
Exports are the goods and services produced in one country and purchased by residents of another country. Besides being a source of foreign exchange, exports are a good indicator of competitiveness. Exports and imports combined make up a country's trade balance. When the country exports more than it imports, it has a trade surplus. When it imports more than it exports, it has a trade deficit. Saskatchewan typically runs a trade surplus in international goods.
Saskatchewan exports of goods and services, including those from other provinces, accounted for 63% of provincial GDP in 2017 (the latest available). Imports of goods and services, including those from other provinces, accounted for 57%. Monthly data is only available for international exports and imports of goods.
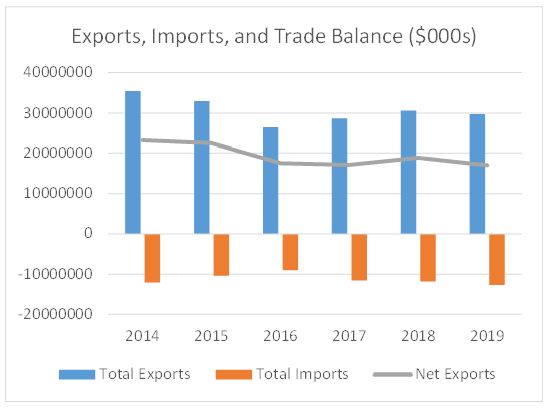
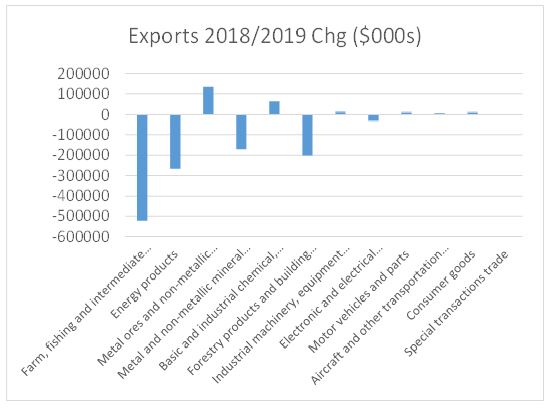
Total International merchandise exports were down -3.0% in 2019 over 2018. Sub sectors that posted increases were: Metal ores and non-metallic minerals (2.1%), Basic and industrial chemical, plastic and rubber products (32.8%), Industrial machinery, equipment and parts (2.2%), Motor vehicles and parts (9.4%), Aircraft and other transportation equipment and parts (237.8%), Consumer goods (13.9%), and Special transactions (1.4%). Sub sectors that posted decreases were: Farm, fishing and intermediate food products (-3.7%) (canola to China), Energy products (-3.2%) (part of the sector wide downturn), Metal and non-metallic mineral products (-28.7%), Forestry products and building and packaging materials (-19.6%), and Electronic and electrical equipment and parts (-25.7%).
Mining and Oil and Gas Extraction is the largest industry in Saskatchewan accounting for 26.9% of real GDP in 2017 (the latest data available) followed by agriculture at 8.4%. I addition, resource extraction is a source of high paying, albeit unstable, employment.
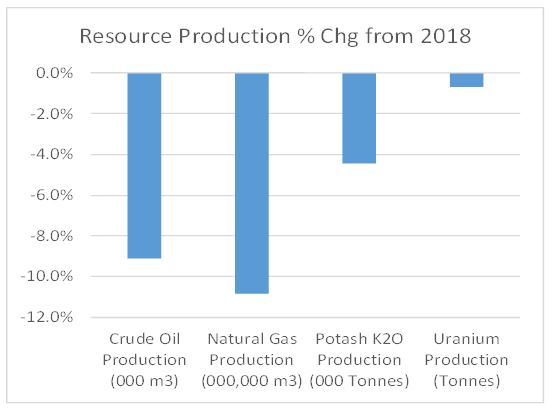
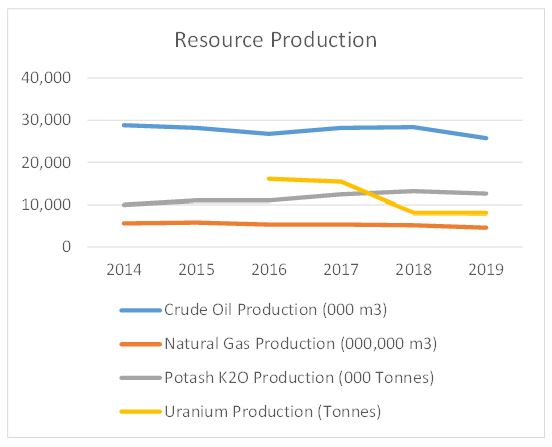 Reflecting soft demand, all major components of resource production declined in 2019 over 2018: Crude Oil Production -9.1%, Natural Gas Production-10.8%, Potash K2O Production -4.4%, and Uranium Production -0.7%.
Outlook for 2020
According to the Conference Board of Canada, prior to the pandemic, the Provincial economy shrank slightly in 2019, following a 1.6% increase in 2018. Real GDP was expected to advance by 1.2% in 2020. After a stellar 2019, employment was expected to increase a further 1.1% in 2020 and the unemployment rate will fall to an average of 5.3% in 2020. The revised, including pandemic impacts, Spring 2020 Outlook sees a 5% decline in real GDP in 2020 and employment in the province is expected to fall by 2.8%. By industry, the largest job losses will be in the arts, entertainment and recreation, and accommodations and food sectors. The Conference Board expects both GDP and employment to rebound in 2021, by 5.4% and 2.9% respectively.
This Issue's Economist:
This Issue's Editor:
TrendLine Saskatchewan is published monthly by Praxis Consulting.
Want TrendLine Saskatchewan Insights Focused on Your Business?
Now Available: Sector deep dives and customized economic reports designed to inform your business decisions.